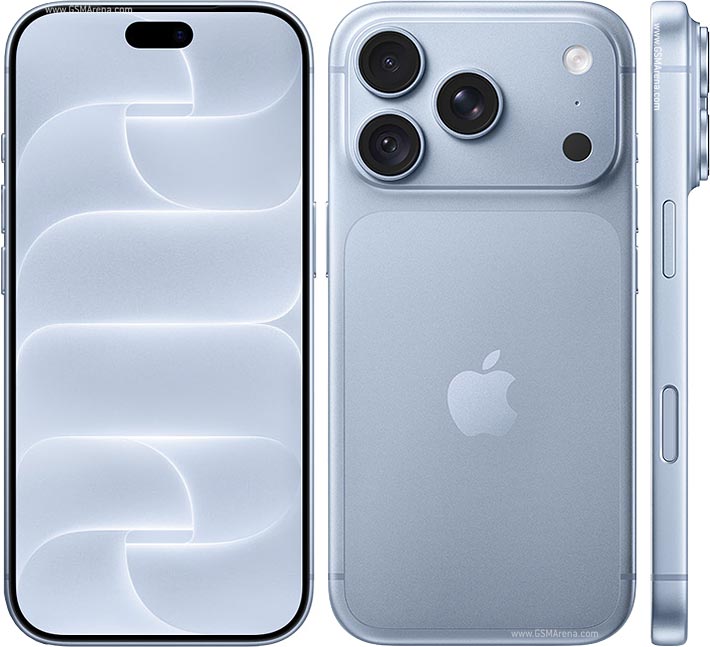
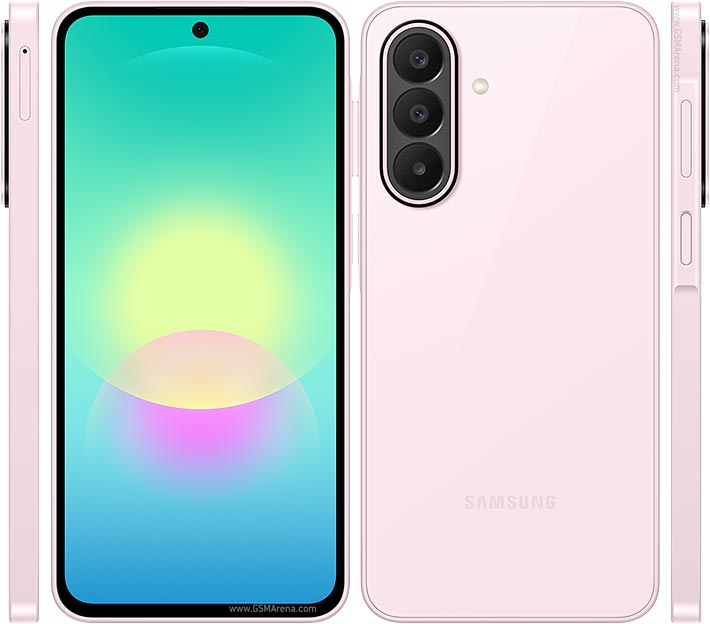
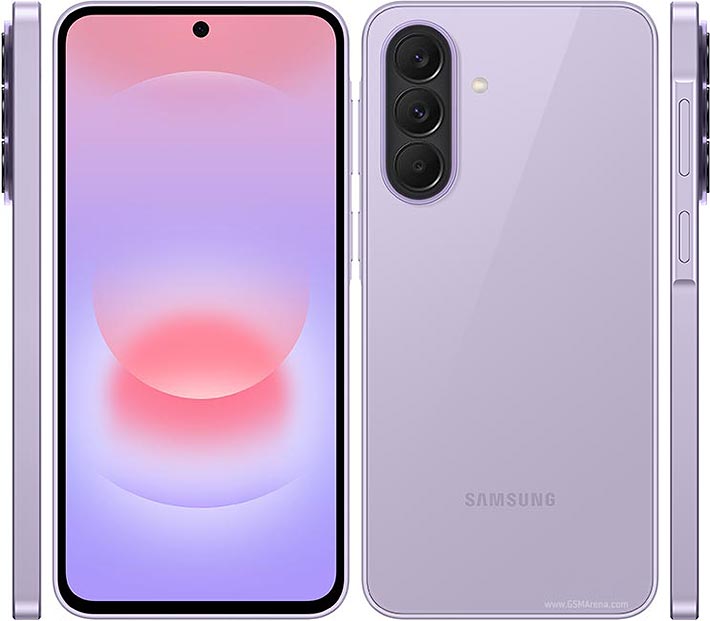
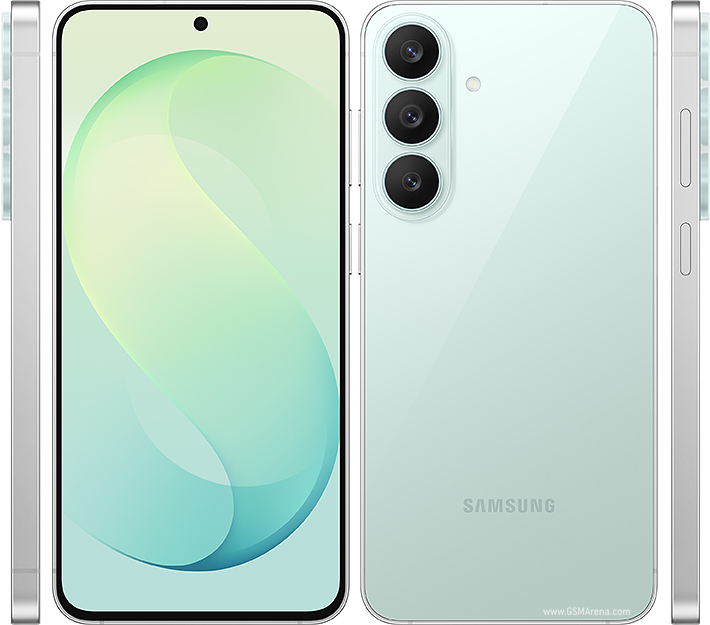
Apple iPhone 13 Pro leads
by 5 points on overall. The category breakdown below shows where the gap comes from.
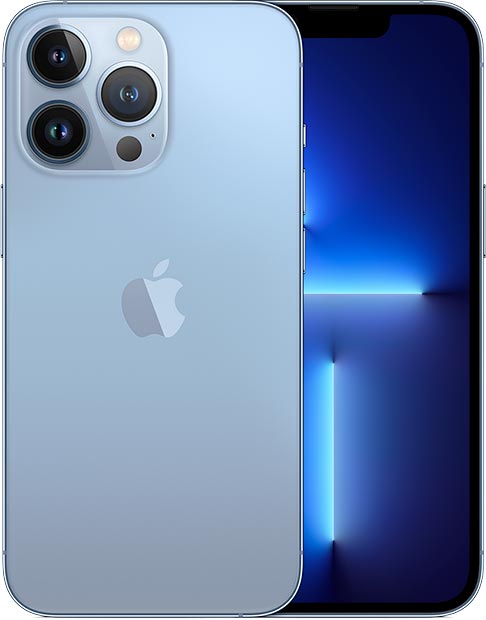
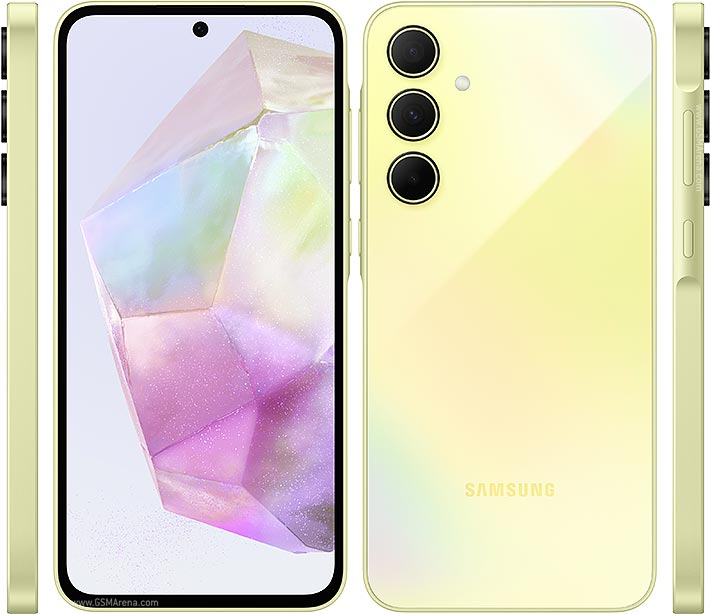
iPhone 13 Pro leads overall versus Galaxy A35. Software: 91.4 vs 62.9.
Scoring profile: balanced
Apple iPhone 13 Pro
Best for users who prioritize performance and display.
Samsung Galaxy A35
Best for users who prioritize camera and battery.
This is MyTechAdvisor's own independently compiled analysis, not the manufacturer's — it's provided for informational purposes only and isn't guaranteed to be complete or error-free. See our editorial policy.
Spec table
Start with the key differences, then expand a section to check the full specifications.
Visible rows
56
Meaningful differences
29
Layout
Full side-by-side mode
Display Size
Key differenceResolution
Key differencePeak Brightness
Key differencePixel Density
Key differenceRefresh Rate
Panel Type
HDR Support
Display Protection
| Specification | Apple iPhone 13 Pro | Samsung Galaxy A35 |
|---|---|---|
Display Size Phone B leads | 6.1" | 6.6"Better |
Resolution Phone A leads | 1170 x 2532Better | 1080 x 2340 |
Refresh Rate Close match | 120Hz | 120Hz |
Peak Brightness Phone A leads | 1200 nitsBetter | 1000 nits |
Pixel Density Phone A leads | 457 ppiBetter | 390 ppi |
Panel Type Close match | OLED | OLED |
HDR Support Needs more data | Yes | Not available |
Display Protection Needs more data | Ceramic Shield glass | Corning Gorilla Glass Victus+ |
RAM
Key differenceCPU Clock
Key differenceCPU Cluster Speeds
Key differenceBenchmark Score
Key differenceAnTuTu Score
Key differenceGeekbench (Multi)
Key differenceStorage
Key differenceChipset
Key differenceRAM Type
CPU Cores
Geekbench (Single)
Storage Type
GPU
| Specification | Apple iPhone 13 Pro | Samsung Galaxy A35 |
|---|---|---|
RAM Phone B leads | 6GB | 12GBBetter |
RAM Type Needs more data | LPDDR4X | Not available |
CPU Clock Phone A leads | 3.23GHzBetter | 2.4GHz |
CPU Cores Needs more data | 6 | Not available |
CPU Cluster Speeds Phone A leads | 2x3.23GHz + 4x1.82GHzBetter | 4x2.4GHz + 4x2.0GHz |
Benchmark Score Phone A leads | 794348Better | 603441 |
AnTuTu Score Phone A leads | 794348Better | 603441 |
Geekbench (Single) Needs more data | Not available | 2740 |
Geekbench (Multi) Phone A leads | 4687Better | 2931 |
Storage Phone A leads | 1024GBBetter | 256GB |
Storage Type Needs more data | NVMe | Not available |
Chipset Phone A leads | Apple A15 Bionic (5 nm)Better | Exynos 1380 (5 nm) |
GPU Needs more data | Apple GPU (5-core graphics) | Mali-G68 MP5 |
Rear Camera
Key differenceRear Camera (All Lenses)
Key differenceRear Sensor Size
Key differenceRear Aperture
Key differenceMax Video Resolution
Key differenceFront Camera
Key differenceFront Video Resolution
Key differenceOptical Zoom
Digital Zoom
Optical Image Stabilization
Front Aperture
Camera Features
| Specification | Apple iPhone 13 Pro | Samsung Galaxy A35 |
|---|---|---|
Rear Camera Phone B leads | 12MP | 50MPBetter |
Rear Camera (All Lenses) Phone B leads | 12MP | 50MP + 8MP + 5MPBetter |
Rear Sensor Size Phone A leads | 1/1.7Better | 1/1.96 |
Rear Aperture Phone A leads | f/1.5Better | f/1.8 |
Optical Zoom Needs more data | 3x | Not available |
Digital Zoom Needs more data | 5x | Not available |
Optical Image Stabilization Close match | Yes | Yes |
Max Video Resolution Phone A leads | 4K@24/25/30/60fps, 1080p@25/30/60/120/240fps, 10‑bit HDR, Dolby Vision HDR (up to 60fps), ProRes, stereo sound rec.Better | 4K@30fps, 1080p@30/60fps, gyro-EIS |
Front Camera Phone B leads | 12MP | 13MPBetter |
Front Aperture Close match | f/2.2 | f/2.2 |
Front Video Resolution Phone A leads | 4K@24/25/30/60fps, 1080p@25/30/60/120fps, gyro-EISBetter | 4K@30fps, 1080p@30fps |
Camera Features Needs more data | Dual-LED dual-tone flash, HDR (photo/panorama) | LED flash, panorama, HDR |
Generating honest comparison...
iPhone 13 Pro generally outperforms Galaxy A35 across key categories. Display Size: 6.6" vs 6.1" This makes iPhone 13 Pro the better choice for most users, though Galaxy A35 may excel in specific areas.
Best for users who prioritize performance and display. iPhone 13 Pro excels in processing power and multitasking.
Best for photographers and content creators. Galaxy A35 offers superior camera capabilities with strong battery.
Non-PTA
PTA
| Price | Apple iPhone 13 Pro | Samsung Galaxy A35 |
|---|---|---|
| Non-PTA | ≈ Rs 50,400 – Rs 98,000 | ≈ Rs 53,928 |
| PTA | -- | -- |
≈ Converted from a fetched price. Store offers, when available, are listed separately.
Choosing between Apple iPhone 13 Pro and Samsung Galaxy A35 can be tough. This comparison breaks down performance, camera, battery, and listed pricing so you can decide faster.
We focus on practical differences that impact daily use, not just spec sheet noise.
Apple iPhone 13 Pro wins more categories overall, making it the safer all‑round pick.
Apple iPhone 13 Pro is the better choice overall, winning in 4 key categories.
The top differences are: Display Size (Samsung Galaxy A35 advantage), Resolution (Apple iPhone 13 Pro advantage), Peak Brightness (Apple iPhone 13 Pro advantage), Pixel Density (Apple iPhone 13 Pro advantage), RAM (Samsung Galaxy A35 advantage).
Samsung Galaxy A35 delivers better camera performance overall.
Samsung Galaxy A35 tends to last longer on a charge.
Apple iPhone 13 Pro: non-PTA approximately Rs 50,400 – Rs 98,000; PTA not entered. Samsung Galaxy A35: non-PTA approximately Rs 53,928; PTA not entered. These are phone reference prices, not optional store offers.
Use our phone finder for a personalized recommendation.